Fifteen airports make up this 2026 list, headed by Singapore Changi, Seoul Incheon, and Tokyo Haneda. But “best” shifts with the yardstick. A passenger-satisfaction award gives Changi a fourteenth title; a consumer-operational index puts Düsseldorf top of its smaller-airport group; volume data keeps Atlanta first with 106.3 million passengers.
Before trusting any 2026 list of the world’s best airports, check what it actually measures.
Pick a list of the best airports in the world and you’re usually reading one publisher’s answer to a question written for its own audience. The 2026 season makes the dilemma unusually plain: three credible scorecards crown three separate winners, because they measure three different things.
One surveys passenger satisfaction, one scores operational efficiency through technical criteria, and one counts raw passenger volume. This list is for anyone choosing where to connect, what to expect on arrival, and which ranking deserves trust. It logs the fifteen airports topping the 2026 passenger-satisfaction table — Changi, Incheon, Haneda, and the rest — then asks what that table reveals and what it quietly skips.
At a glance
- Singapore Changi Airport
- Incheon International Airport
- Tokyo Haneda Airport
- Hong Kong International Airport
- Narita International Airport
- Paris Charles de Gaulle Airport
- Rome Fiumicino Airport
- Istanbul Airport
- Munich Airport
- Vancouver International Airport
- Helsinki-Vantaa Airport
- Chubu Centrair Nagoya
- Dubai International Airport
- Riyadh Airport
- Vienna International Airport
The 2026 top fifteen, in order
1. Singapore Changi Airport
First place, topping the 2026 Skytrax table.
Changi’s 2026 pick is its fourteenth time at the top of the Skytrax World Airport Awards. The result comes from a survey fielded across more than 100 nations between August 2025 and February 2026. Travelers scored airports on six experience areas: immigration, dining and shopping, terminal comfort, security, check-in efficiency, and the gate departure experience.
The award doesn’t account for traffic volume, operational delays, or hubs that choose not to take part. That gap matters — it’s why “best” means something different depending on which table you’re reading.
| Index | What it measures | 2026 winner | What it misses |
|---|---|---|---|
| Skytrax World Airport Awards (World’s Best Airport) | Passenger satisfaction covering check-in, access, comfort, cleanliness, immigration, security, shopping, PRM facilities, and departure experience. | Singapore Changi Airport | Does not account for traffic volume, operational metrics, or non-participating hubs like Doha Hamad that opt out of awards. |
| ACI World Airport Traffic Dataset (busiest airports) | Total passenger throughput, counting enplaned and deplaned passengers with transit passengers counted once, to rank airports by traffic volume. | Hartsfield-Jackson Atlanta International Airport | Measures crowding and network importance, not passenger experience, amenities, or accessibility; high-volume airports may score poorly on satisfaction. |
| Consumer Choice Center World Consumer Airport Index | Composite Ivanovic I-distance score combining distance to city centre, transport options, choice, delays, security wait times, and sharing-economy services. | Barcelona El Prat (large hubs) and Düsseldorf (smaller airports) | Uses complex statistical weighting not transparent as simple percentages and does not measure subjective passenger satisfaction via surveys. |
| Source: Skytrax World Airport Awards; Consumer Choice Center; ACI World. | |||
2. Incheon International Airport
Second in the 2026 Skytrax table.
Incheon’s consistent top-three placing is why Seoul remains a serious alternative connection point to the Japanese pair. The survey scores what passengers actually experience — immigration processing, terminal comfort, check-in — not network size or ticket volume. Its runner-up finish puts it ahead of every European and North American airport on the list.
3. Tokyo Haneda Airport
Third in both the Skytrax table and ACI’s volume ranking.
Haneda is the clearest evidence that high volume and high satisfaction can coexist. Efficiency and accessibility for passengers with reduced mobility are repeated strengths, alongside cleanliness. The airport’s dual top-three showing — among satisfied passengers and counted throughput — carries weight for anyone choosing a Japan connection point.
4. Hong Kong International Airport
Fourth, back inside the top five.
Hong Kong’s return to the top five matters for the post-pandemic hub competition. Its position is a passenger-experience verdict, not an operational audit: the survey asks travelers to rate their own journey through the terminal. But the index never explains how much any single criterion moves the final rank, which makes every position below first a rough relative statement.
5. Narita International Airport
Fifth, completing Tokyo’s two-airport top-five.
Narita gives Tokyo the only two-airport presence inside the top five. The airport handles much of Japan’s long-haul portfolio, and its satisfaction score shows the survey rewards predictable processes rather than architectural novelty. Both Tokyo entries benefit from the same national reputation for order and punctuality — though the survey does not test whether that cultural pattern drives the scores.
6. Paris Charles de Gaulle Airport
Sixth — the highest-ranked European airport in the table.
Charles de Gaulle’s position as the top European entry will surprise travelers whose last memory is a long Terminal 2 walk. It is a reminder that the survey produces a composite satisfaction score. A high rank can coexist with well-known pain points the summary table doesn’t surface — specific routes, specific terminals, specific queue times.
7. Rome Fiumicino Airport
Seventh, and firmly in the top ten.
Fiumicino has rebuilt its reputation over a decade, and its satisfaction rank now places it above hubs many travelers would expect to rank higher. The result reflects sustained investment in the terminal-experience details the survey asks about. For a traveler choosing an Italian connection point, that rehabilitation is useful signal.
8. Istanbul Airport
Eighth.
Istanbul’s hub sits inside the top ten at eighth, a position built on scale and a strong retail offering in the new terminal. Its location makes it a natural Europe-Asia transit point. The rank says less about the disconnect between transit and local passengers, and nothing about peak-hour immigration times — the moments travelers actually remember.
9. Munich Airport
Ninth.
Munich closes the European quartet at ninth, just ahead of the only North American airport in the top ten. For Europe-to-Asia connection flows, Munich matters as both a major Lufthansa hub and a reliable southbound alternative. Its ranking validates what regulars already know: the airport scores consistently on the experience measures the survey values.
10. Vancouver International Airport
The only North American airport in the top ten — at tenth.
Vancouver carries an entire continent. The continental split is the most under-read number in the 2026 results: five Asian, four European, one North American airport inside the top ten. Why US hubs fail to break through is not documented in this dataset. Infrastructure age, immigration processing, and terminal design are plausible — but the survey doesn’t test them. What it does show is a satisfaction gap with real consequences for connection choices.
11. Helsinki-Vantaa Airport
Eleventh, just outside the top ten.
Helsinki-Vantaa’s high finish relative to its volume proves satisfaction is not a traffic contest. The Nordic gateway benefits from a compact footprint and predictable, lower-stress processing. On the Consumer Choice Center index, facilities are split into large and smaller groups at a documented 47.2-million-passenger mark, so airports of Helsinki’s scale can be scored against peers rather than against Atlanta.
12. Chubu Centrair Nagoya
Twelfth.
Chubu Centrair Nagoya makes Japan the only country with three airports in the top fifteen — Haneda, Narita, and Nagoya. That concentration says something about national operational culture. Nagoya’s presence is also a quiet argument for considering secondary Japanese gateways when connecting through central Japan, where the hub alternatives split traffic and deliver consistent scores.
13. Dubai International Airport
Thirteenth in satisfaction; second in ACI’s 2025 volume data.
Dubai is the split-screen case. Passenger satisfaction lands it thirteenth. ACI’s throughput dataset ranks it second globally, behind Atlanta. For a connecting traveler, those two numbers answer different questions: how pleasant the experience feels versus how many people you’ll be sharing the terminal with. A high-volume hub that still cracks the top fifteen on satisfaction is doing something useful. The gap between the two positions also shows why composite “best” labels hide more than they reveal.
14. Riyadh Airport
Fourteenth.
Riyadh’s presence is the quiet subplot of the 2026 cycle. It appears while its Gulf neighbor Doha Hamad does not — Doha withdrew from the Skytrax awards and other industry events, citing regional conflict and a focus on staff and passenger wellbeing. That withdrawal is the one documented case this year of a major hub stepping away. It makes every remaining rank on this list an opt-in outcome, not a census.
15. Vienna International Airport
Fifteenth, closing the list.
Vienna rounds out the top fifteen, ahead of airports that dominate volume or network lists but score lower on passenger experience. For a traveler, that’s the actionable difference: this list answers “where will I personally have a better terminal day,” not “where does the most traffic flow.” The names above are the answer to the first question only.
Flight deals
most people never see
Our AI monitors 150+ airlines for pricing anomalies that traditional search engines miss. Air Traveler Club members save $650 per trip per person on average: see how it works.
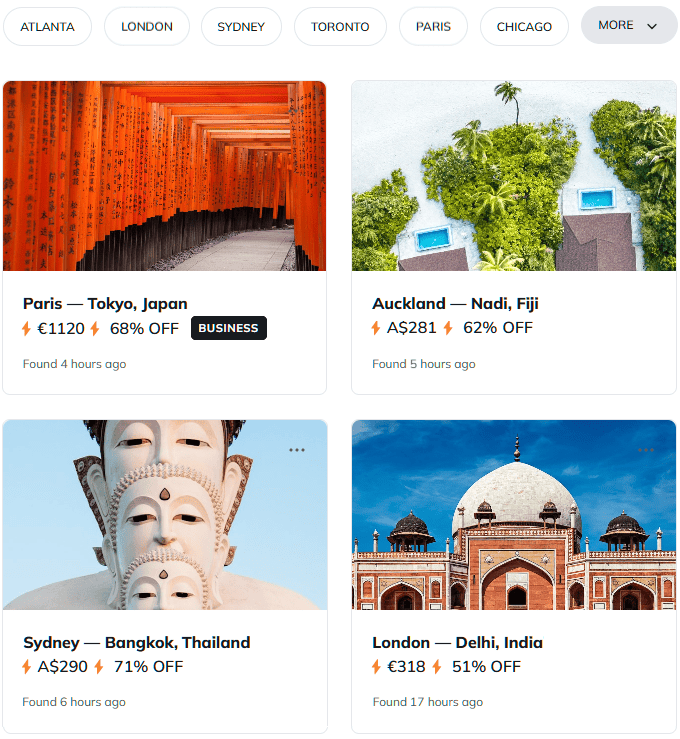
Each deal saves 40–80% vs. regular fares:
How we picked
The fifteen positions follow the 2026 Skytrax World Airport Awards top-fifteen table as published. For cross-checks, we pulled the Consumer Choice Center’s 60-airport, 16-criteria operational index and ACI World‘s 2025 passenger-throughput dataset. Each methodology is presented as published, including where weightings go undisclosed. Rankings and figures were confirmed against the organisations’ 2026 public releases.
How to decide which “best airports in the world” list to trust
Start with the question you’re actually asking. Choosing a long-haul connection point or flying with reduced-mobility needs? Satisfaction scores are the useful signal. The Skytrax survey ranks what travelers experience — immigration queues, terminal comfort, security screening, baggage delivery, PRM access. Tokyo Haneda’s combination of efficiency, accessibility, and cleanliness is the clearest case of why that measure matters.
Concerned about congestion and network scale? ACI’s throughput data is the better lens. Atlanta’s 106.3 million passengers in 2025 explains why a US gateway can feel crowded even when its satisfaction rank trails Asian hubs. If your itinerary routes through a high-volume hub, that number shapes your experience more than any award.
The Consumer Choice Center index sits between the two. Its composite Ivanovic I-distance score blends city-centre distance, transport options, airline and destination choice, delays, security wait times, and sharing-economy services. It crowns Europe’s Düsseldorf in the smaller segment and Barcelona El Prat among large hubs. But the method publishes no transparent percentage weights, so treat its ordering as a relative operational read rather than a satisfaction verdict.
A missing name is a clue, too. Doha Hamad’s withdrawal — the one documented opt-out this year — is a reminder that rankings depend on participation. Use these lists as inputs, not final answers. The only honest move is to match the index to the decision.
Key terms
- Skytrax World Airport Awards
- An annual passenger-satisfaction ranking of airports worldwide, based on surveys of travelers across more than 100 nations. The 2026 edition fielded responses between August 2025 and February 2026, scoring airports on immigration, dining and shopping, terminal comfort, security, check-in efficiency, and gate departure experience. In this article, it supplies the top-fifteen order — headed by Singapore Changi — that the rest of the analysis examines.
- ACI World Airport Traffic Dataset
- The Airports Council International’s annual count of total passenger throughput at airports globally, tallying everyone who boards and disembarks with transit passengers counted once. It ranks airports by volume rather than experience, making it the standard reference for congestion and network importance. Here it provides the counterpoint to Skytrax: Atlanta’s 106.3 million passengers tops the 2025 ranking, while Dubai sits second and Tokyo Haneda third.
- Ivanovic I-distance
- A composite scoring method that standardizes each input variable by dividing its gap from the minimum by that variable’s standard deviation, then discounts it by the running product of (1 – r²) against earlier variables. The Consumer Choice Center uses it to blend distance to city centre, transport options, passenger numbers, and amenities into a single operational score with a theoretical ceiling of 30. In the 2026 World Consumer Airport Index, it crowns Barcelona El Prat among large hubs and Düsseldorf among smaller airports.
- PRM facilities
- Services and infrastructure for passengers with reduced mobility, covering access, assistance, and terminal navigation. Skytrax includes PRM facilities among the experience areas travelers score, alongside immigration, security, and terminal comfort. Tokyo Haneda’s repeated strength in accessibility is one reason its dual top-three showing — in satisfaction and ACI volume — carries weight for travelers with mobility needs.